
People often talk about “mapping” a car. When they do that they’re usually interested in one or more of three things:
- To increase its performance
- Improve its fuel economy
- Improve its drivability
So what is mapping?
In technical terms a map is a translation, or conversion, function that takes an input and produces an output. We talk about “mapping” the input to the output. i.e. we take lots of different input data and convert it into another form as an output. This can be done by way of a formula, also known as a function, or with a lookup table, which we’ll talk about later.
Mapping happens in many computing situations, power stations, chemical plants, washing machines, in car ECUs, almost anywhere there is a computer handling physical process.
Lookup Tables
Lookup tables are typically how ECU’s convert the input sensor data into the output data that gets fed into controlling the engine. They are like multiplication times tables we used at school, i.e. they’re a simple way of taking a question (what’s 4 x 5?) and “looking up” the answer (20). In this example 4 is one input, 5 is another input and 20 is the output. And that gets us a two dimensional lookup table.
For times-tables, we “look up” the result by searching across the row and down the column of the table to find the result of the multiplication. This is what ECU’s use the maps for… they are lookup tables.
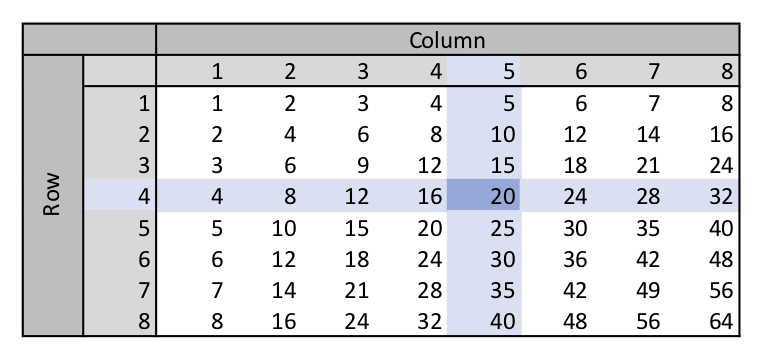
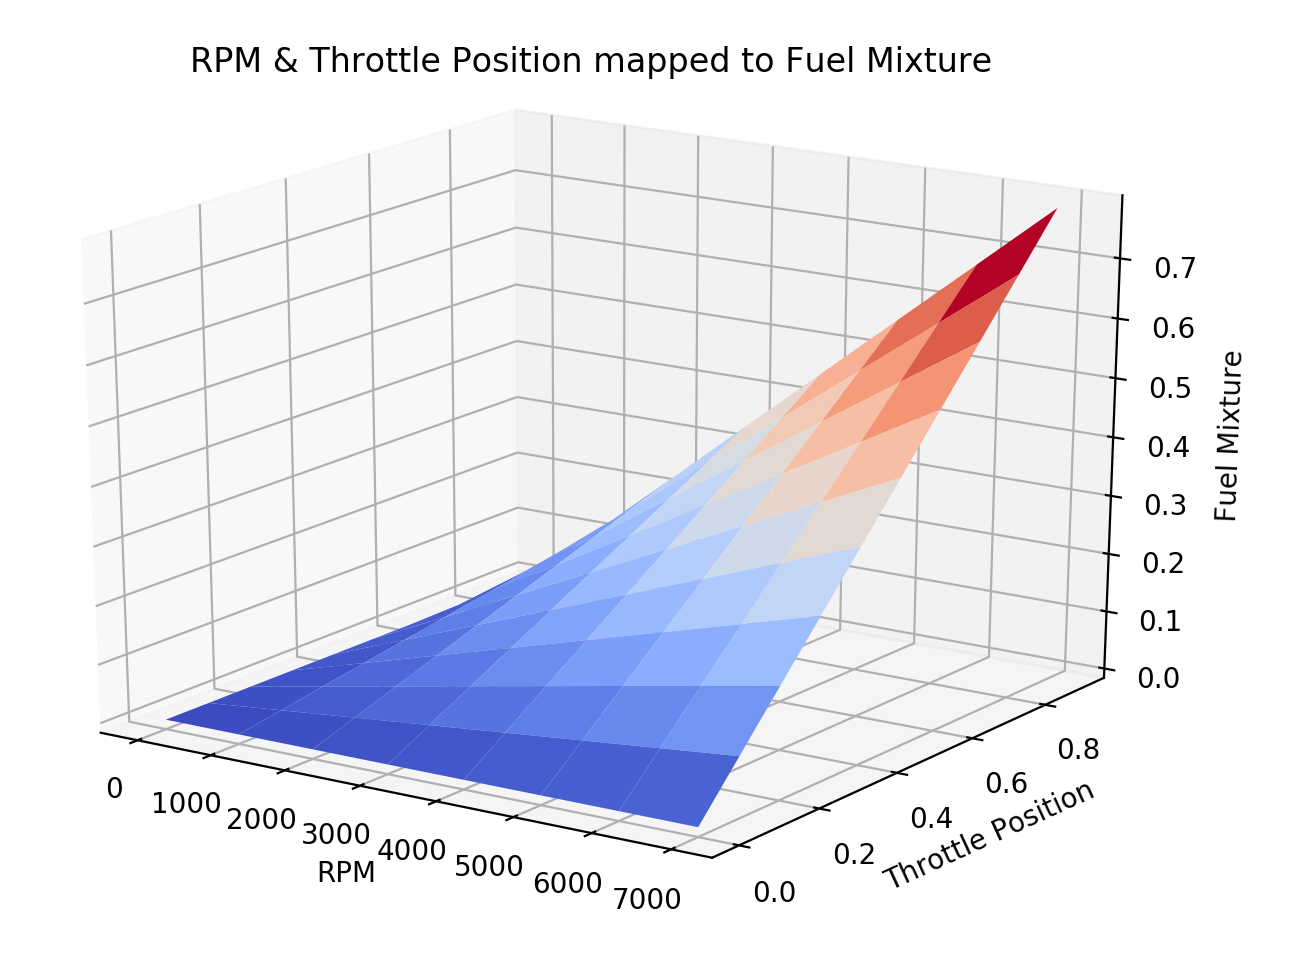
The times table above is shown flat on the page, but we can also draw it in three dimensions, like this:
That 3D diagram is the exact same times-table as was drawn before, but now its in 3D rather than 2D.
One type of engine map is exactly like these times tables. The rows on one axis of the map are one input (i.e. RPM) and along the other axis are the columns with the other input (i.e. throttle position). So, this particular example “map” might take RPM on one axis and throttle position on the other and the number we might get when we do the lookup along the rows and columns might be the fuel mixture setting for a particular RPM and throttle position – I’ve made this map up at the moment, but you hopefully get the idea.
That type of map is a two dimensional lookup. But this is where things get a little more complicated, MBE seems to call these 3D maps. And you can see why I guess. We can draw our rows and columns for the inputs and then draw the result as height above the floor of the map. Sort of like making a 3D map of a mountain.
There are other types of lookup, for instance 1D and 2D. I’m still not entirely sure what MBE mean by 1D maps… and how do they differ from the input data from the sensors but I’ll update this post when I figure that out.
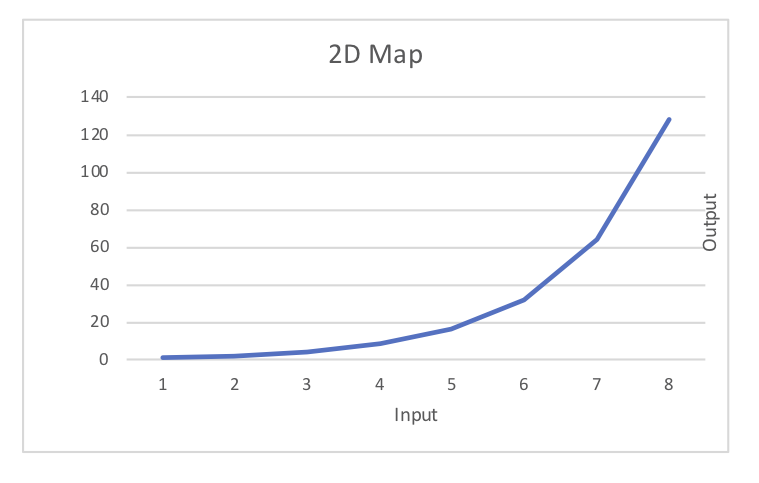
A 2D mapping is a lookup table where there’s one input and one output, which might look a bit like this, you read the input along the bottom and then find the output by going up until you reach the line:
Interpolation
Another critical part in how ECU’s use maps is called Interpolation. Interpolation is used to fill in “holes” in the map.
As we’ve seen, a lookup table allows you to take some inputs and “map” them to an output. And you can read across each axis of the lookup table to get to an output. But for some inputs there would be thousands of rows of data to lookup and the table would become huge. For instance, with RPM, the car can go from 0 to 7900 RPM, that would need 7900 rows on the lookup table. To cut down on the amount of memory needed to store these lookup tables in the ECU, the tables are what we call, sparsely populated, meaning that not all the rows or columns are laid out in the table.
Lets take a look at another example to explain…
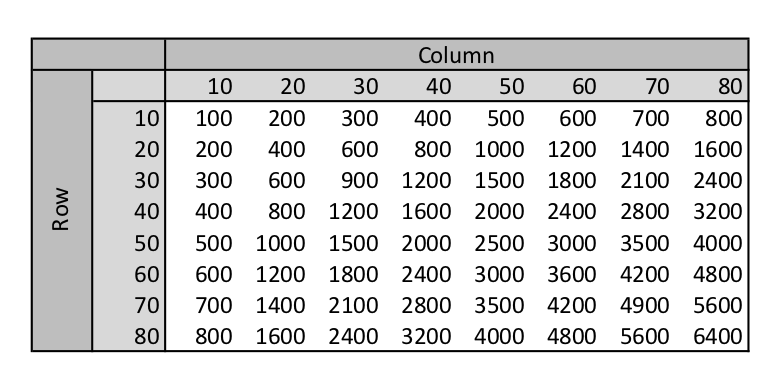
As you can see in the table above, we have inputs going down the left of 10 to 80 and inputs along the top also going from 10 to 80. It’s simple to work out the lookup for an input of 10 and 30, the answer is 300 (this is also a times-table).
But what if we have inputs of 25 and 55 for instance. We can’t just go to row 25 and column 55 because they’re not listed in our table.
We need to use interpolation.
There are a few types of interpolation we could use, but we’re going to stick to the simplest here – linear interpolation.
To do the mathematics behind the interpolation we need the 4 numbers around where we’re doing the lookup. The row we’re interested in is 25, so we need to take values around that, ie. row 20 and row 30. Similarly we’re looking for column 55 so we’ll take value from column 50 and 60.
So, we’re interested in the following data in green:
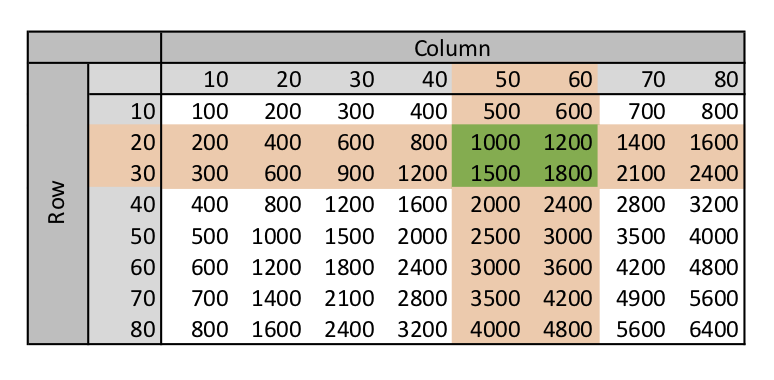
In linear interpolation we assume the jumps between rows and columns is linear, i.e. the graph you draw between adjacent rows and columns is a straight line.
I’m not going to go into the whole maths behind how this would work, but for our example 25 is half way between 20 and 30, and 55 is half way between 50 and 60. That means we can take the four numbers in green and average them:
Output = (1000 + 1200 + 1500 + 1800) / 4 = 1375
We’ve now managed to get an answer from our lookup table for our question (what’s 25 x 55) without needing to have a table that’s 80 columns wide by 80 rows tall. That’s interpolation. And that’s how ECU’s store their maps in memory – they use sparsely populated maps and the micro-processor in the ECU does a lookup followed by the interpolation maths to come up with a mapped answer.
If you want the whole maths behind how that works then wikipedia has a write up on it.
Back to EC2 Files
The EC2 file that we’ll look at a bit more in another post has the following number of maps defined:
- 1037 : 1D-maps
- 137 : 2D-maps
- 67 : 3D-maps
These map configurations in the Easimap EC2 files are just the configuration parameters of the maps, not the data inside the map, and I suspect that nowhere near those 1037+137+67 maps are used in our cars, but that needs more work to figure out how MBE construct the map definitions in the ec2 files.
At the moment there doesn’t seem to be any way of extracting a map from a locked 9A4 ECU. In theory we can build the map by filling in the data as we see the inputs and outputs of each map change. i.e. we can run the car and watch the throttle angle and engine speed then see how the ECU sets the mixture, as all those values change we can build the lookup table.
I’m hoping that I can get a Map file from someone with an unlocked ECU, then I can see if some of my theories about how the data is structure in a Map hold true.
Next we’ll get into the Easimap EC2 files a bit more and extract some data from them to automate the way we can access our ECUs.

Leave a Comment